Ads Analytics Within Jwero
1. Ad analytics
Key Benefits of Ad Analytics:
Performance Tracking: Monitor how many people have seen and interacted with your ad.
Audience Insights: Understand your audience demographics and engagement patterns.
Budget Optimization: Ensure your ad spend is being utilized effectively.
Conversion Analysis: Measure the number of users who took the desired action (e.g., clicked, engaged, purchased).
Ad Refinement: Adjust your targeting, creatives, and messaging based on real-time data.
Using ad analytics, you can make data-driven decisions to improve the effectiveness of your campaigns and maximize your return on investment (ROI).
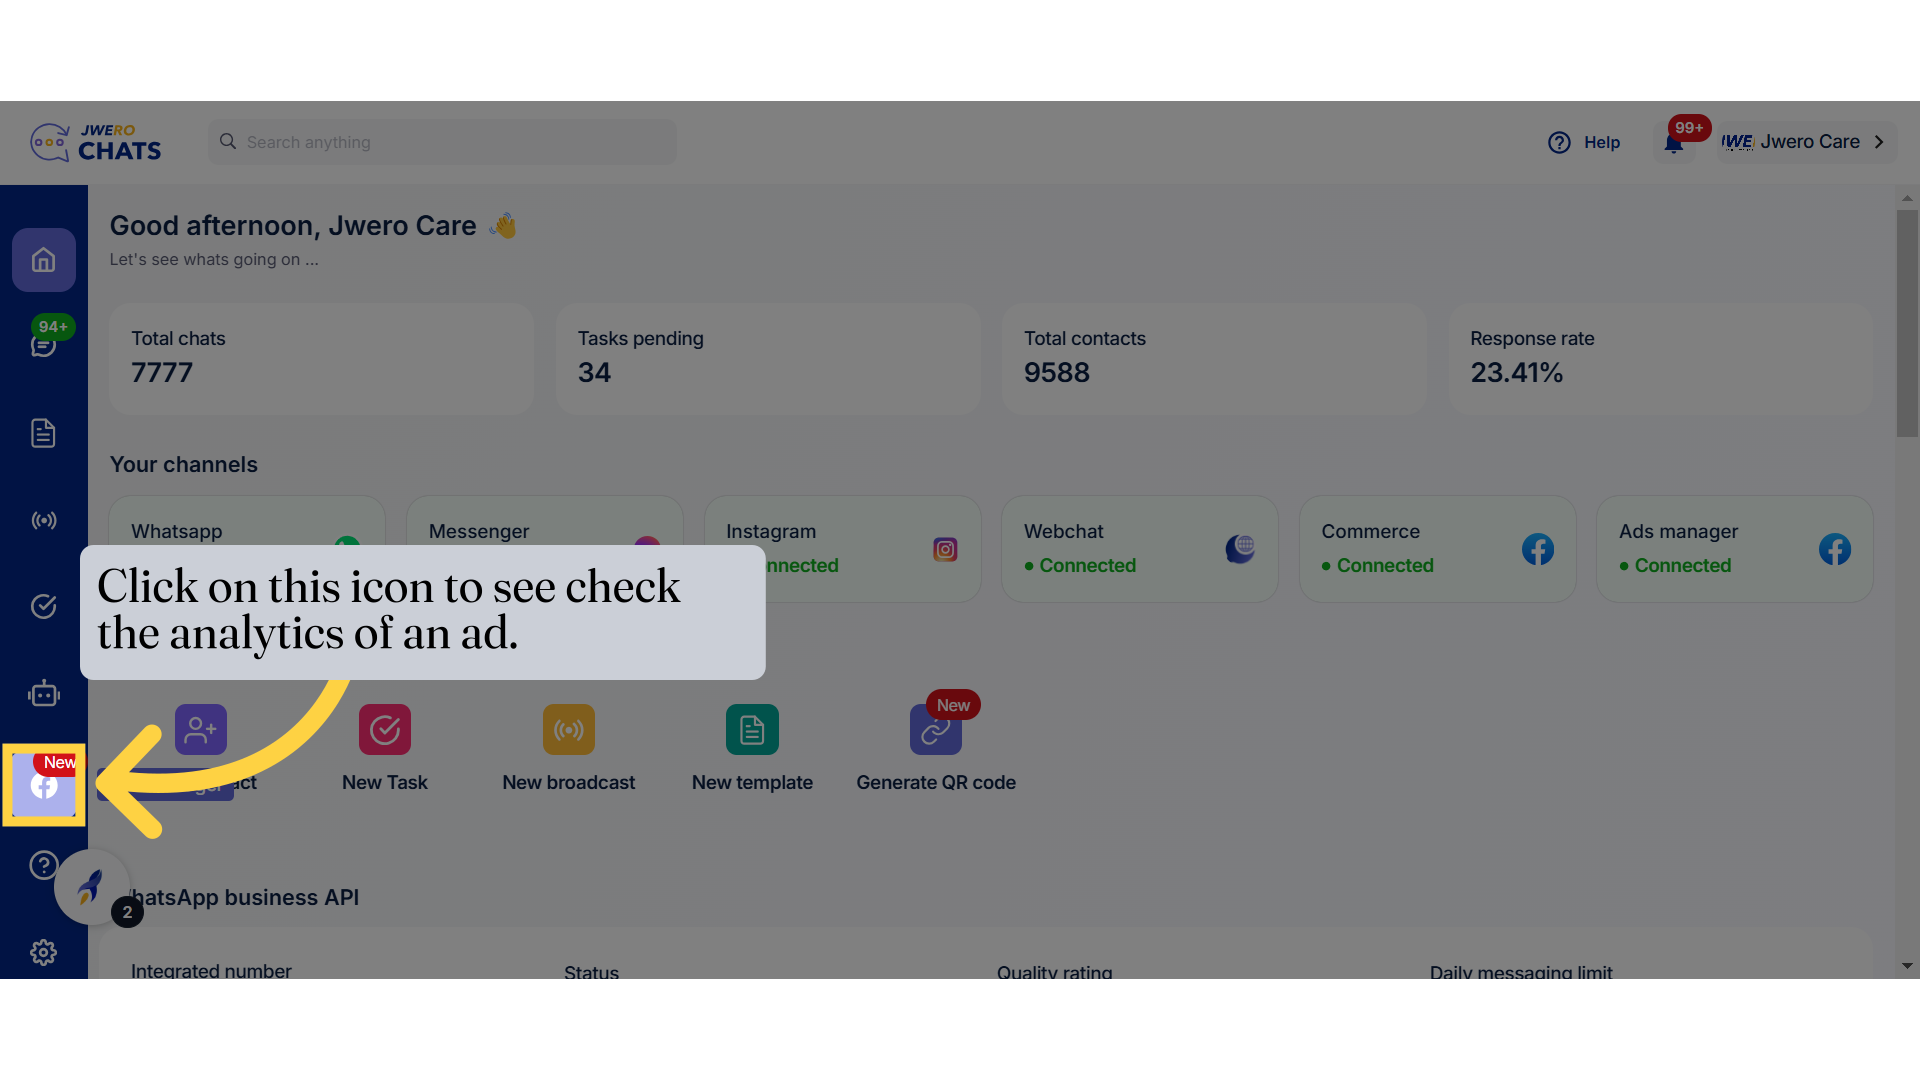
2. Click on this icon to see check the analytics of an ad.
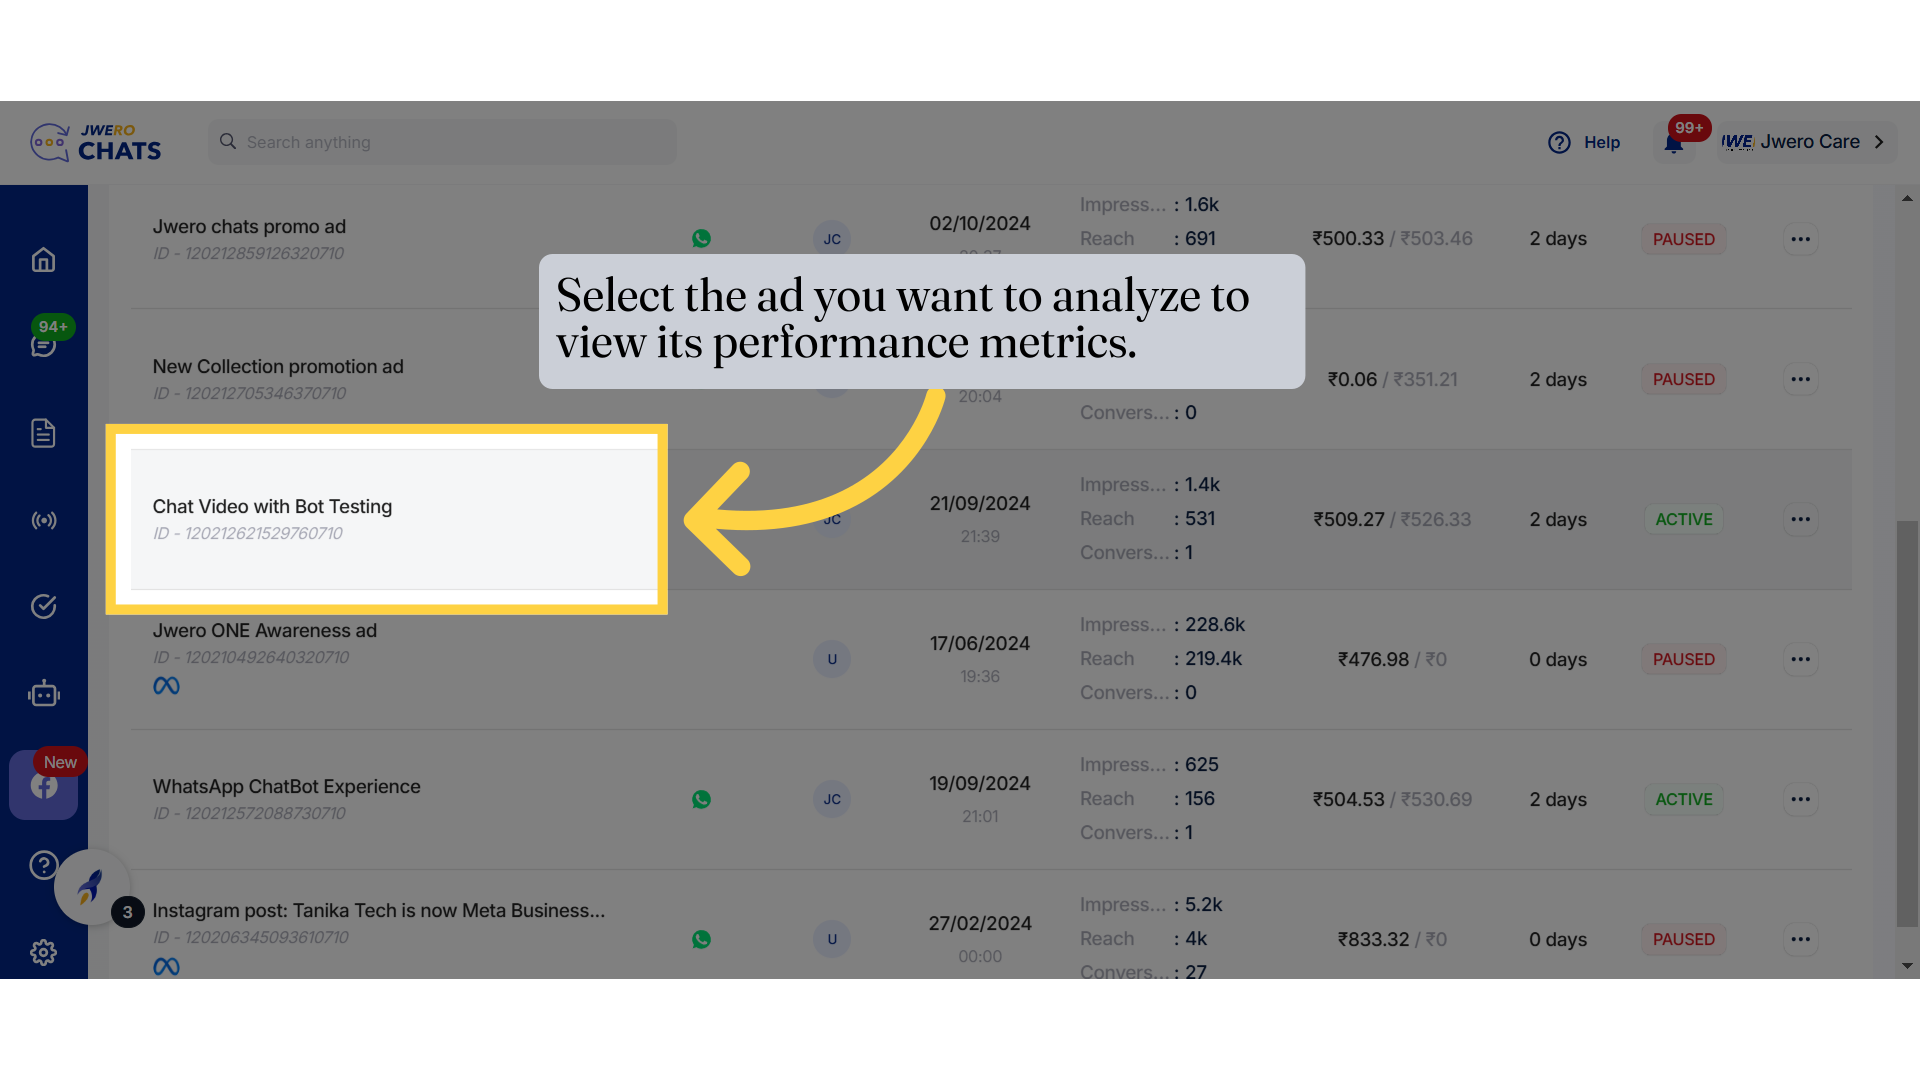
3. Select the ad you want to analyze to view its performance metrics.
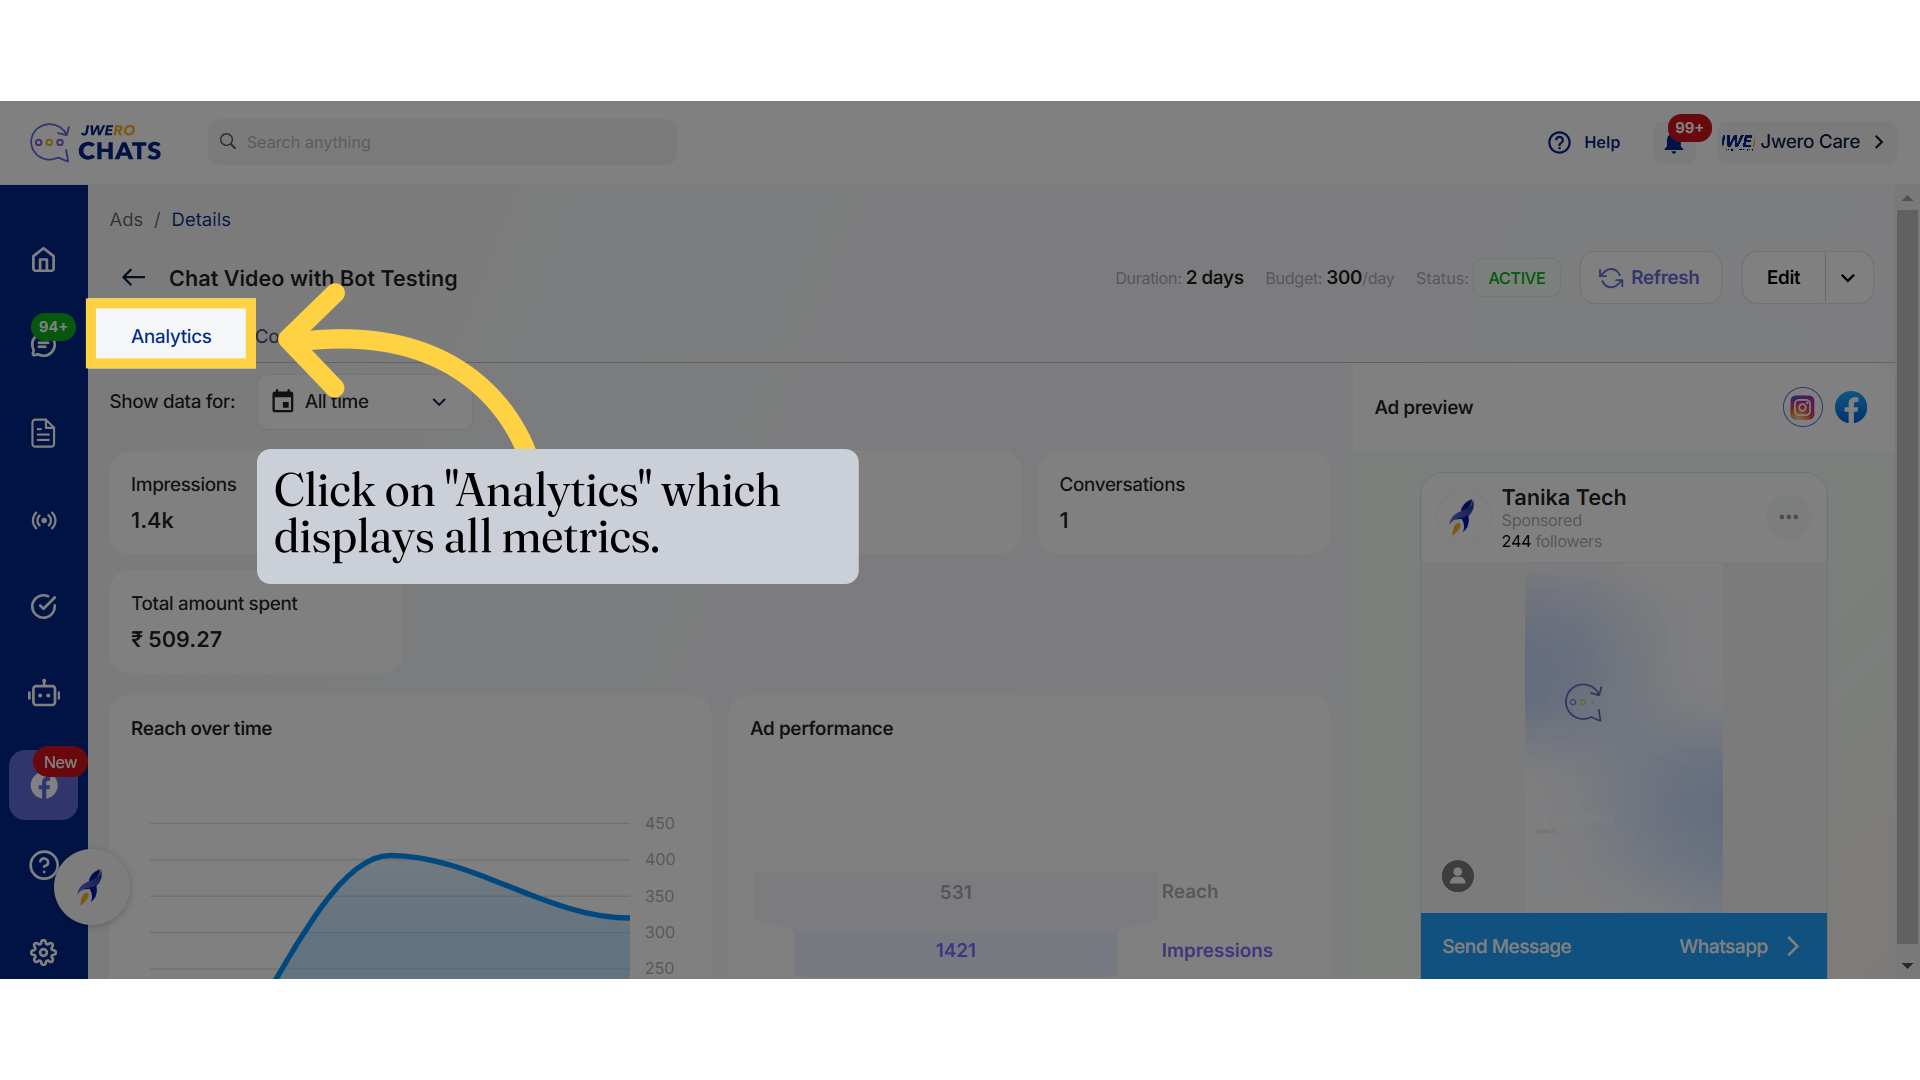
4. Click on "Analytics" which displays all metrics.
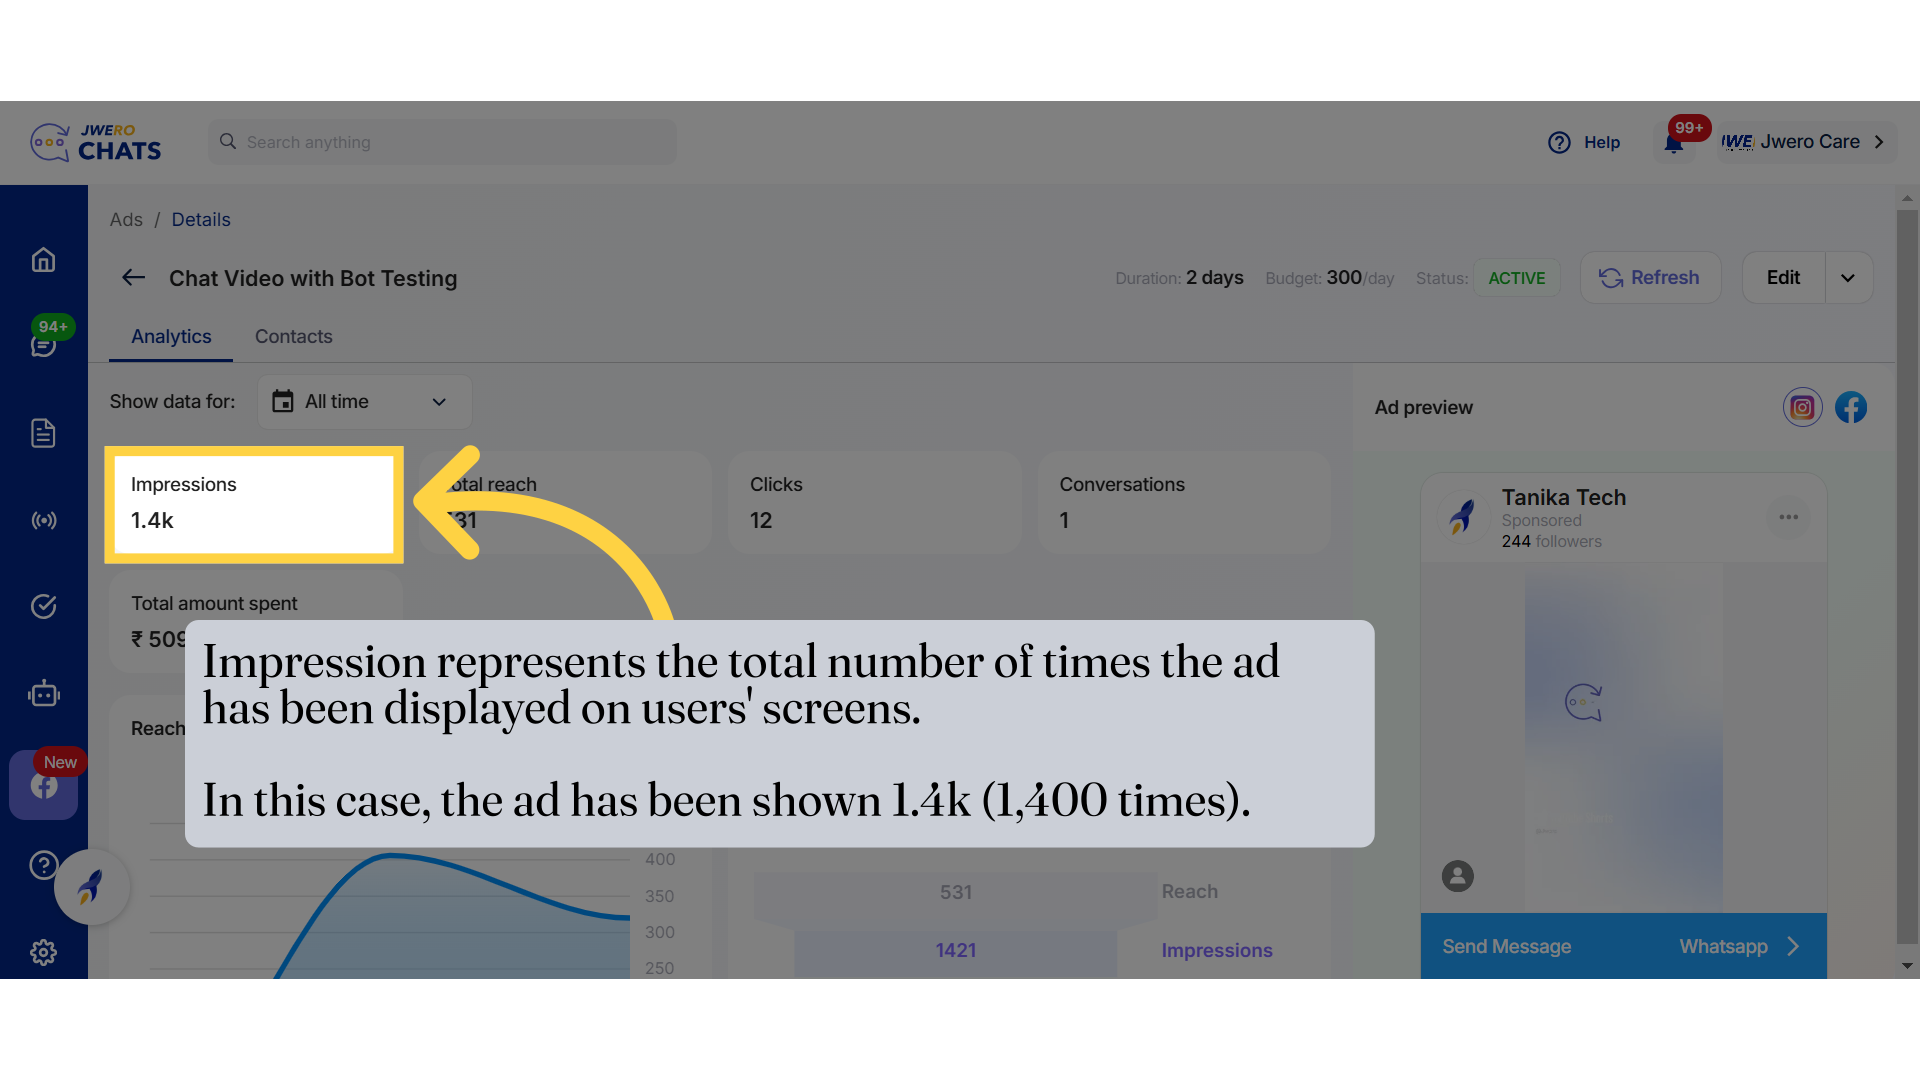
5. Impression represents the total number of times the ad has been displayed on users' screens. In this case, the ad has been shown 1.4k (1,400 times).
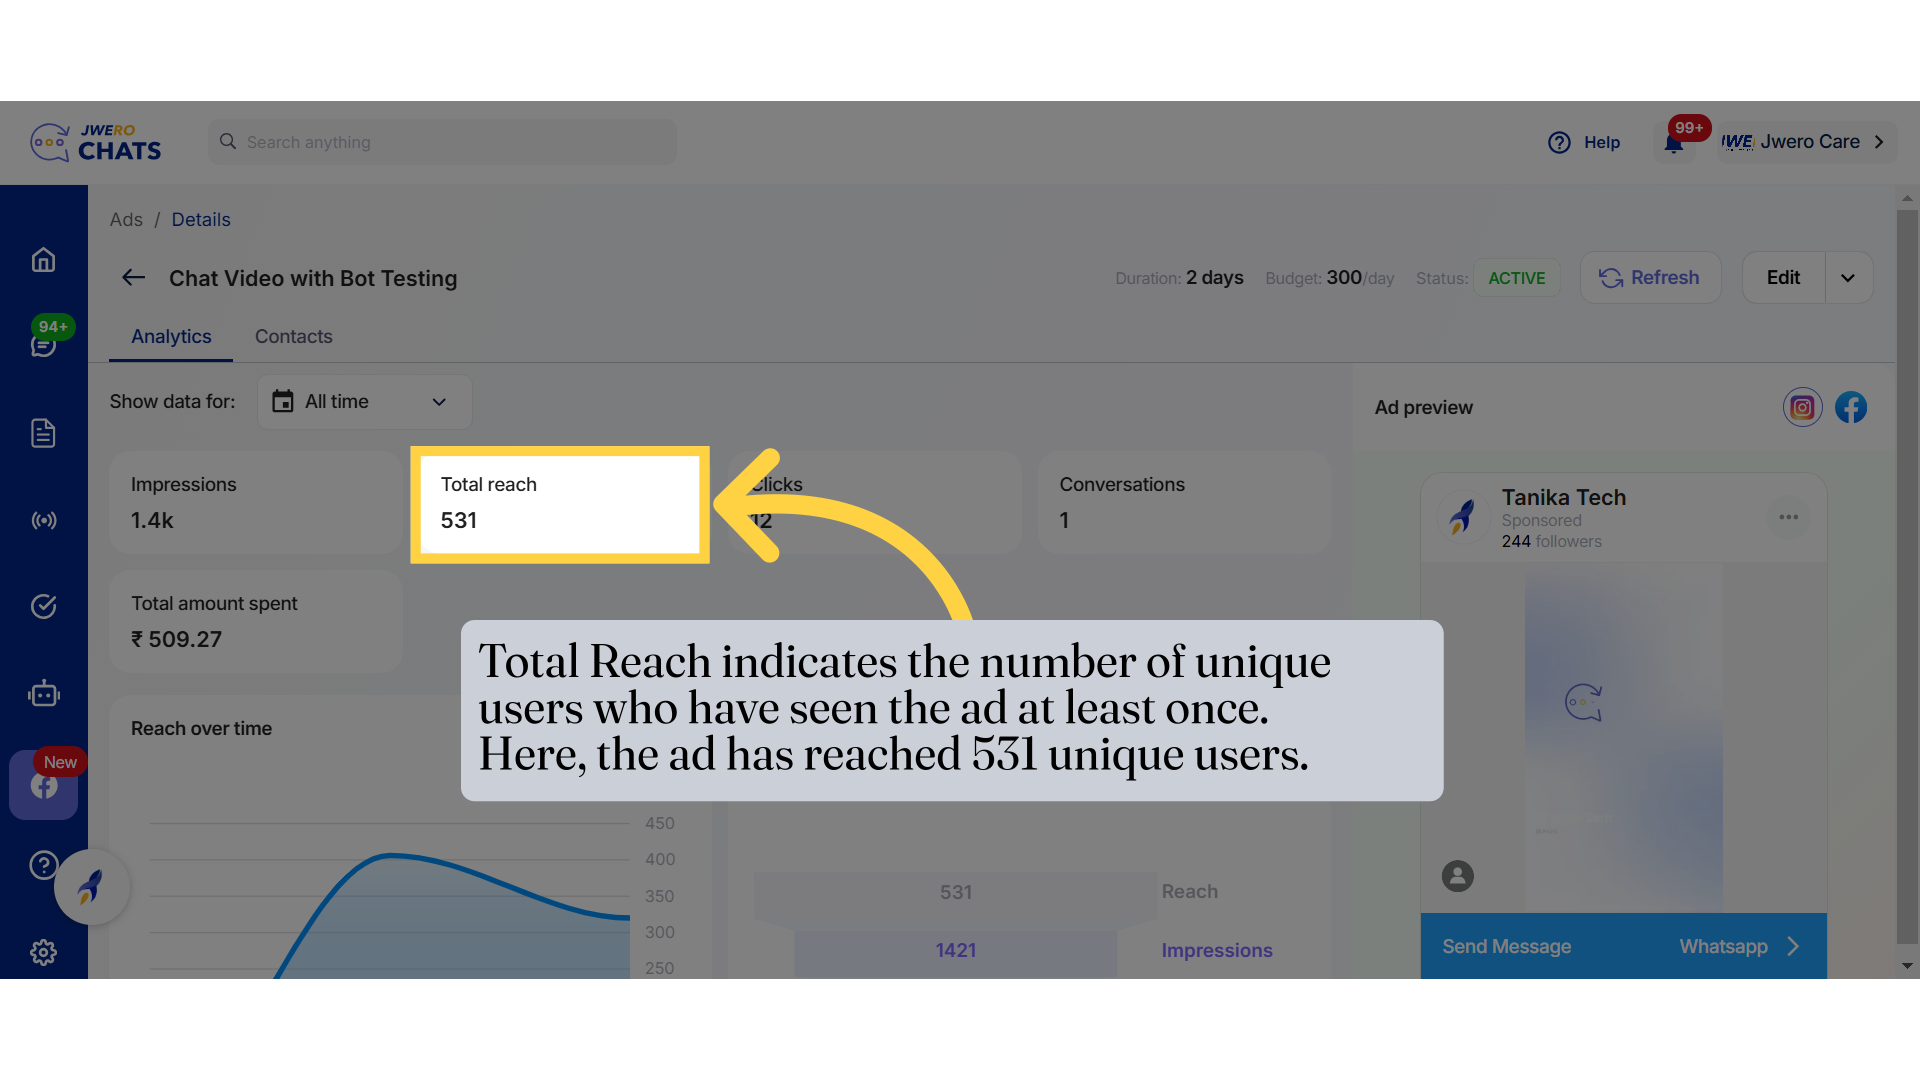
6. Total Reach indicates the number of unique users who have seen the ad at least once. Here, the ad has reached 531 unique users.
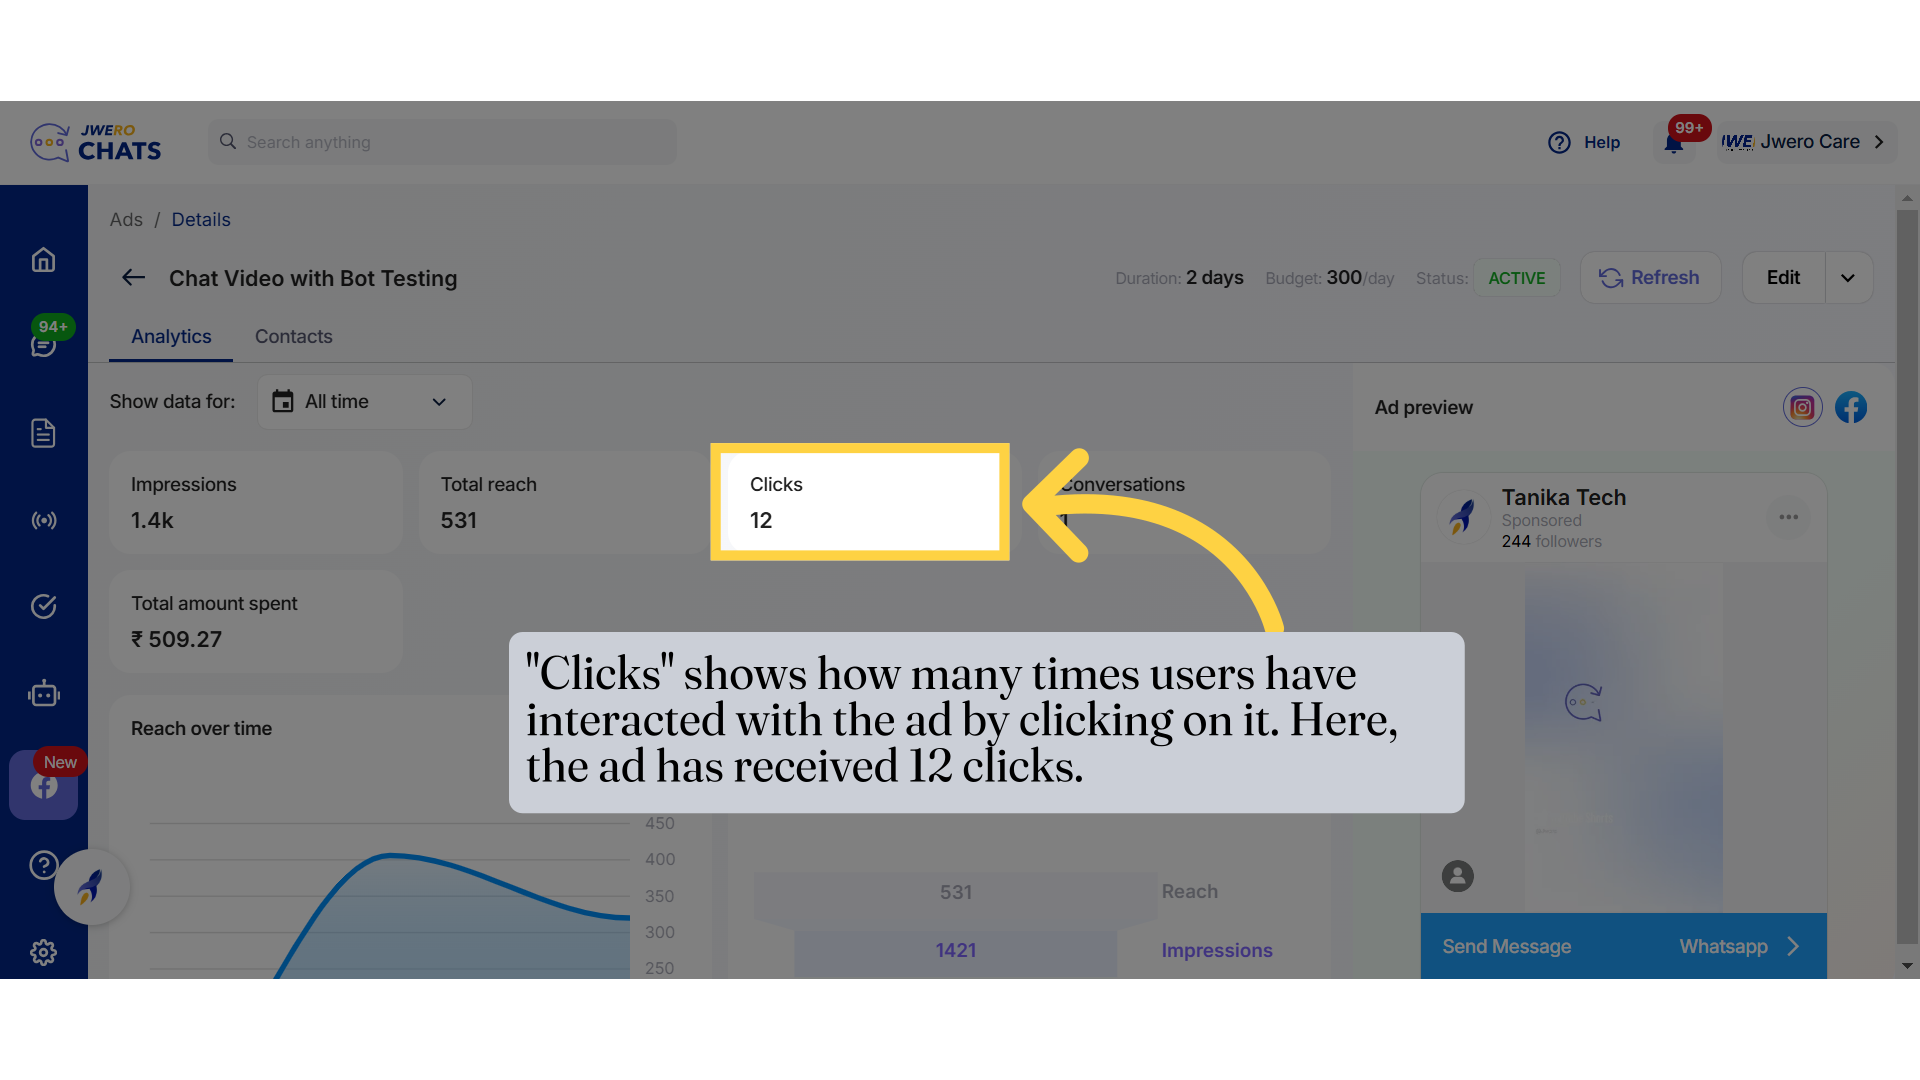
7. "Clicks" shows how many times users have interacted with the ad by clicking on it. Here, the ad has received 12 clicks.
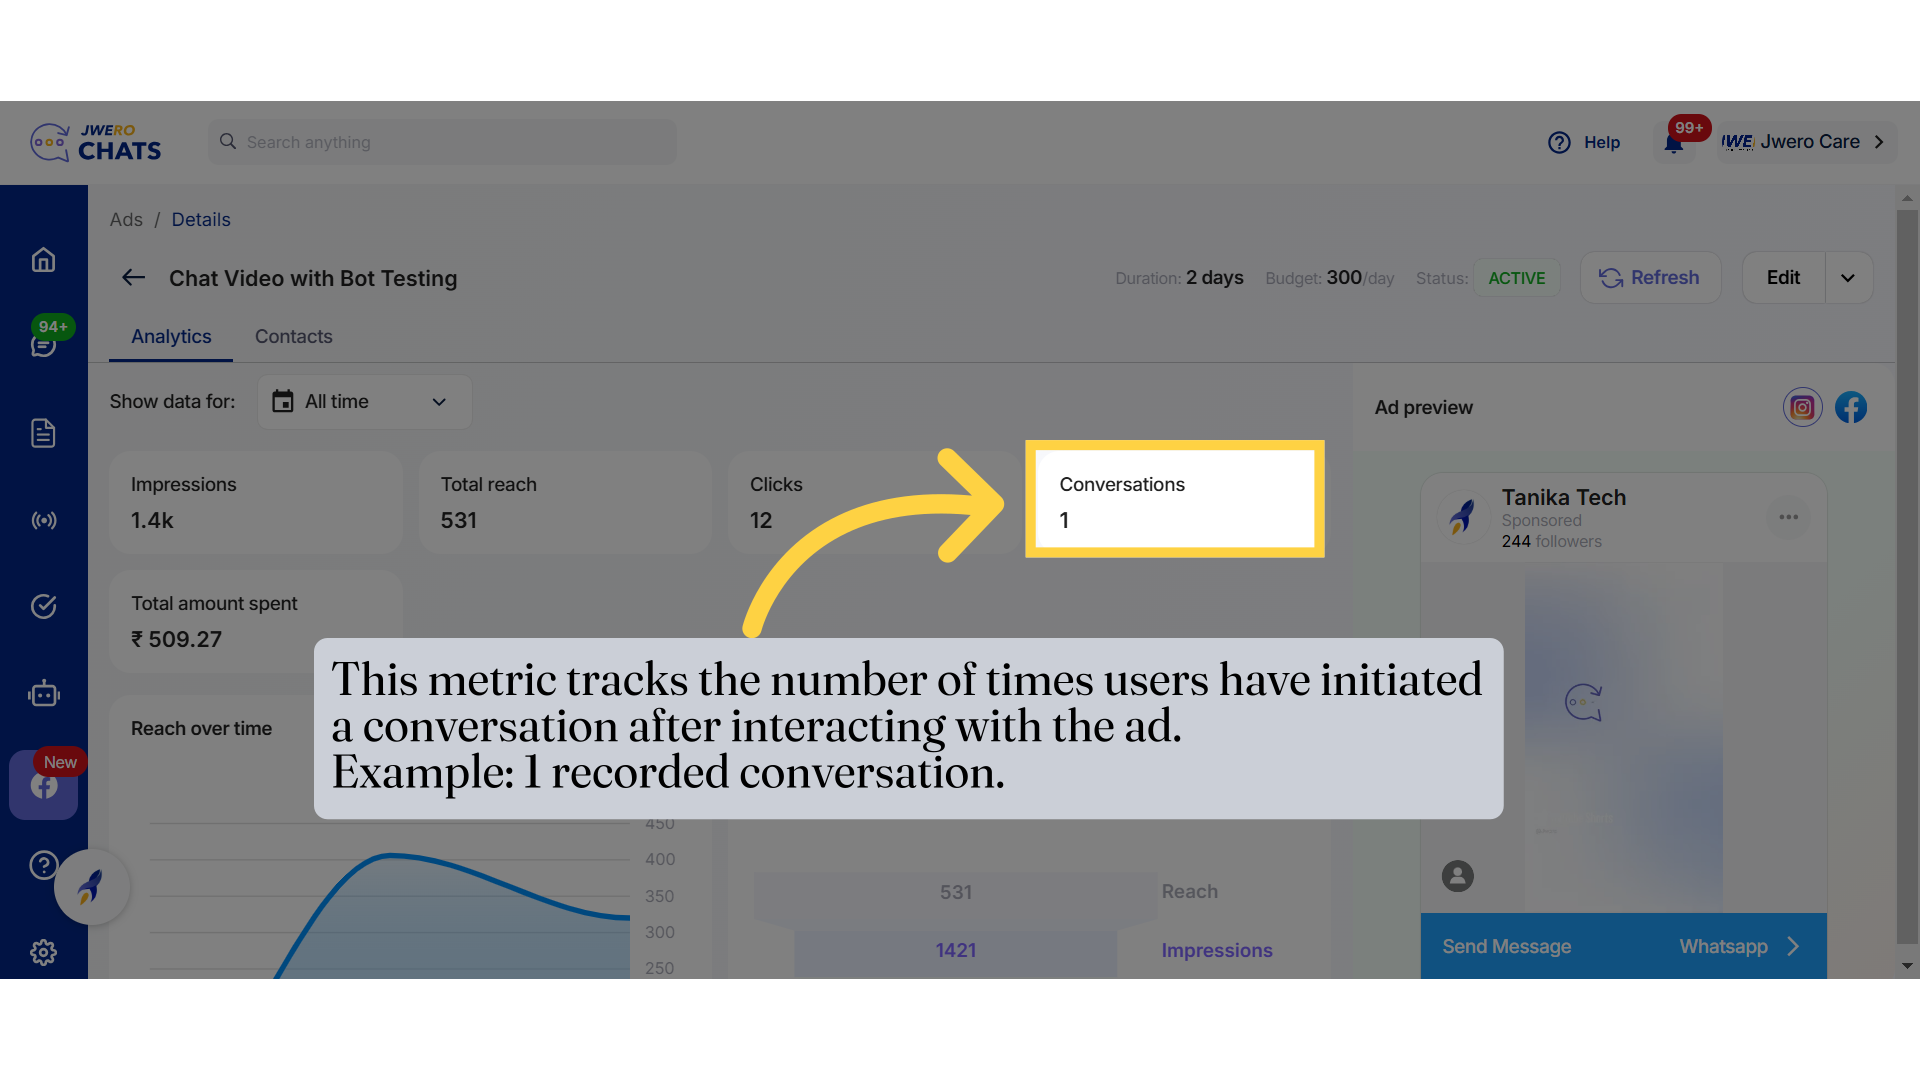
8. This metric tracks the number of times users have initiated a conversation after interacting with the ad.
Example: 1 recorded conversation.
9. The total amount of money spent on running the ad campaign so far. Here, ₹509.27 has been spent.

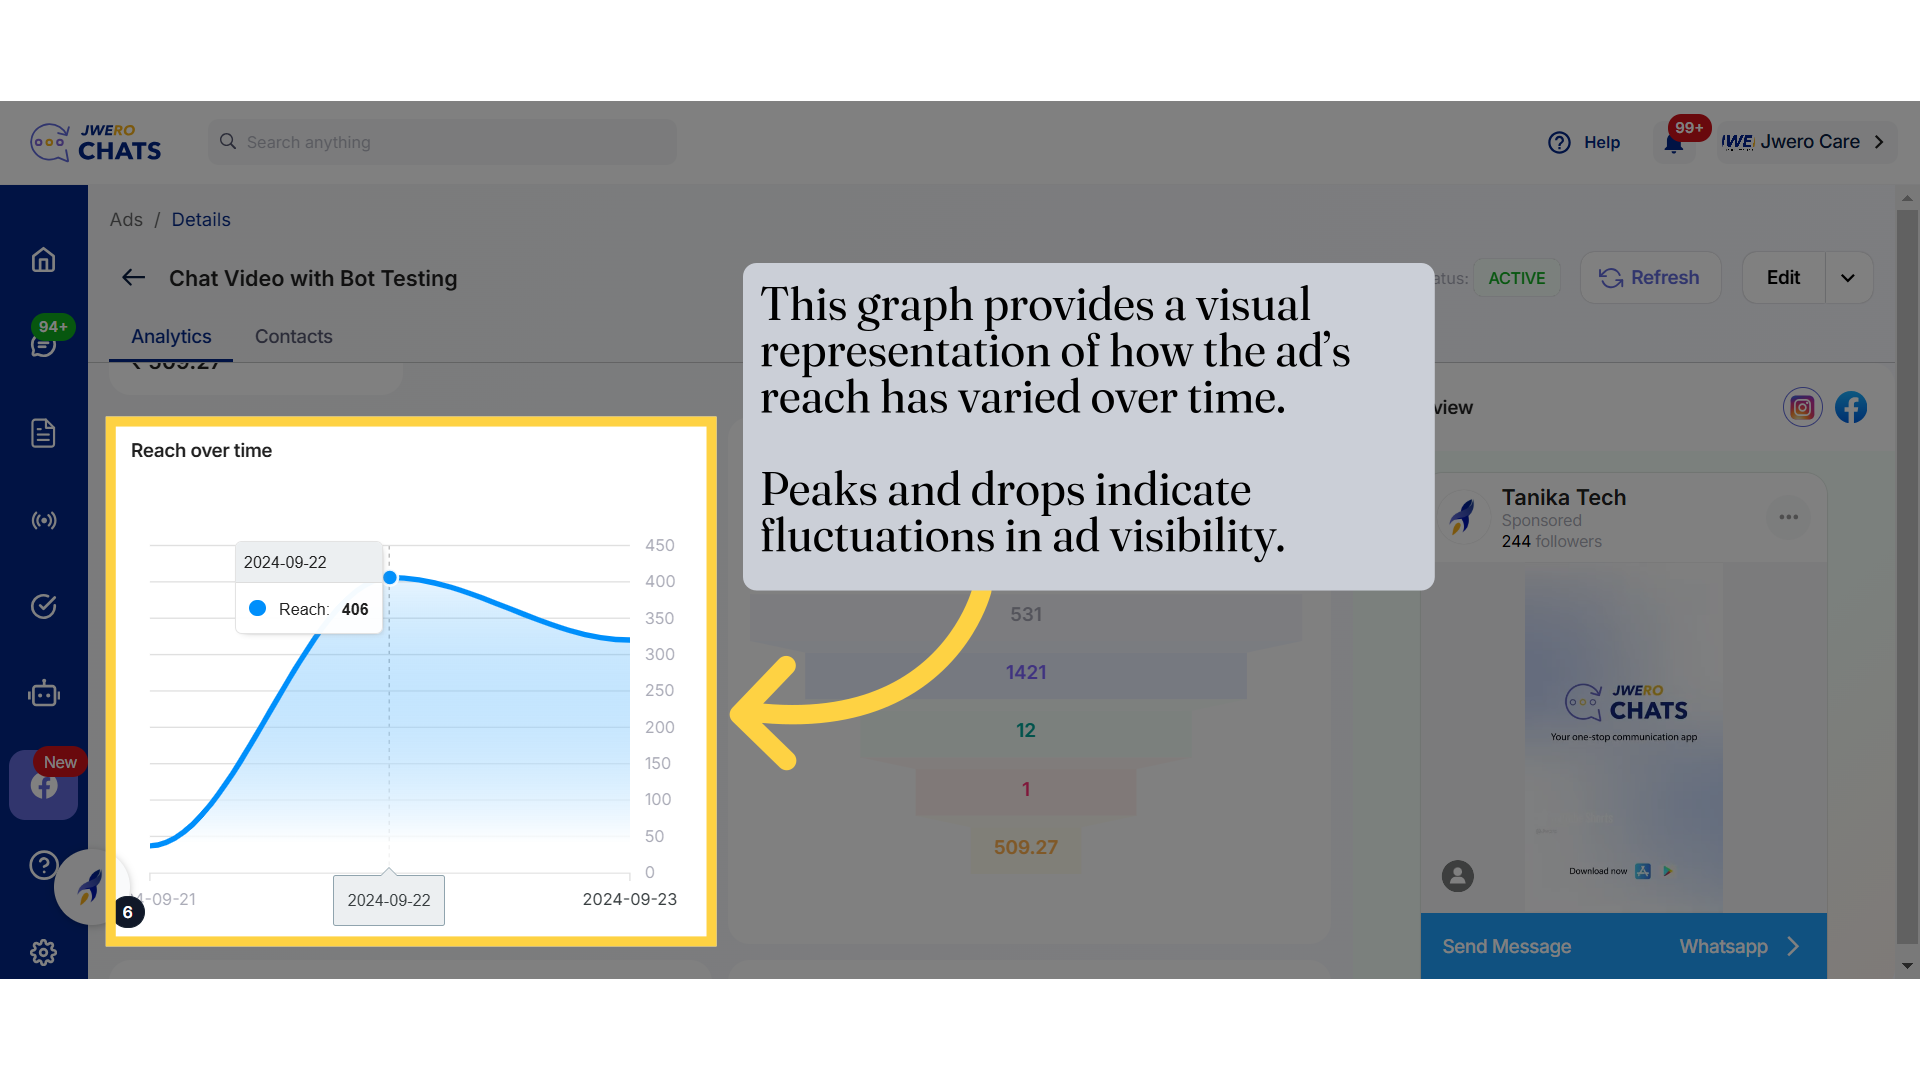
10. Reach over time
Key Insights from Reach Over Time:
Trends & Patterns:
Identify when your ad received the highest and lowest reach.
Helps in determining the best times/days to run future campaigns.
Audience Engagement:
A steady increase in reach over time suggests growing audience interest.
A sharp drop may indicate ad fatigue, where users stop engaging with repeated exposure.
Effectiveness of Budget Allocation:
If reach declines despite an active campaign, it may signal the need for budget adjustments.
Comparing reach trends with daily spend can help optimize ad performance.
Optimization Opportunities:
If reach is low during certain hours or days, adjusting your ad schedule or targeting strategy can improve visibility.
Testing different creatives or ad placements can also help boost reach.
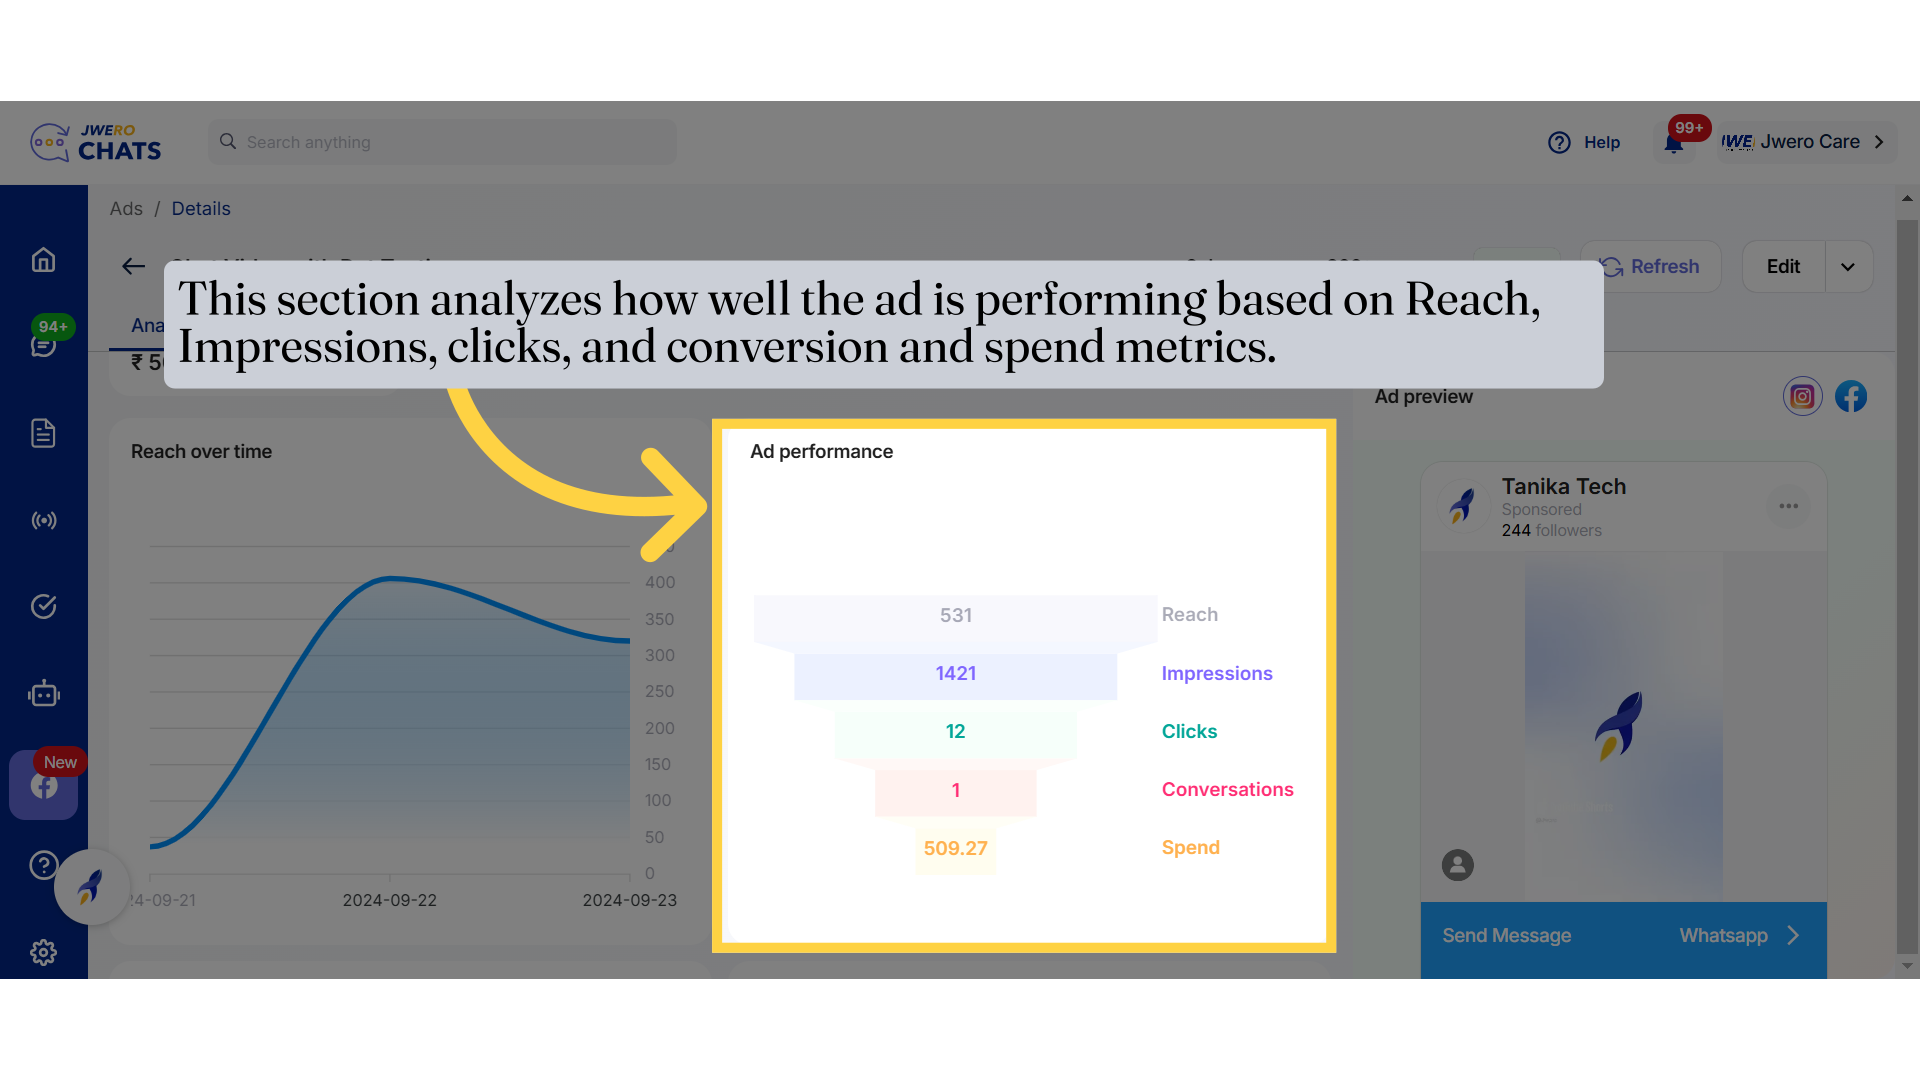
11. Ad performance
Breakdown of Each Metric:
Reach (531) 🟦
The number of unique users who saw your ad.
Indicates how well your ad was distributed to the targeted audience.
Impressions (1421) 🟪
The total number of times your ad was displayed.
A single user can see the ad multiple times, increasing the impression count.
Clicks (12) 🟩
The number of users who clicked on your ad.
Reflects how engaging your ad is in driving users to take action.
Conversations (1) 🟥
The number of users who started a chat or interaction with your business.
Indicates how many users were genuinely interested in engaging further.
Spend (₹509.27) 🟧
The total amount spent on the ad campaign.
Helps in evaluating cost-effectiveness and return on investment (ROI).
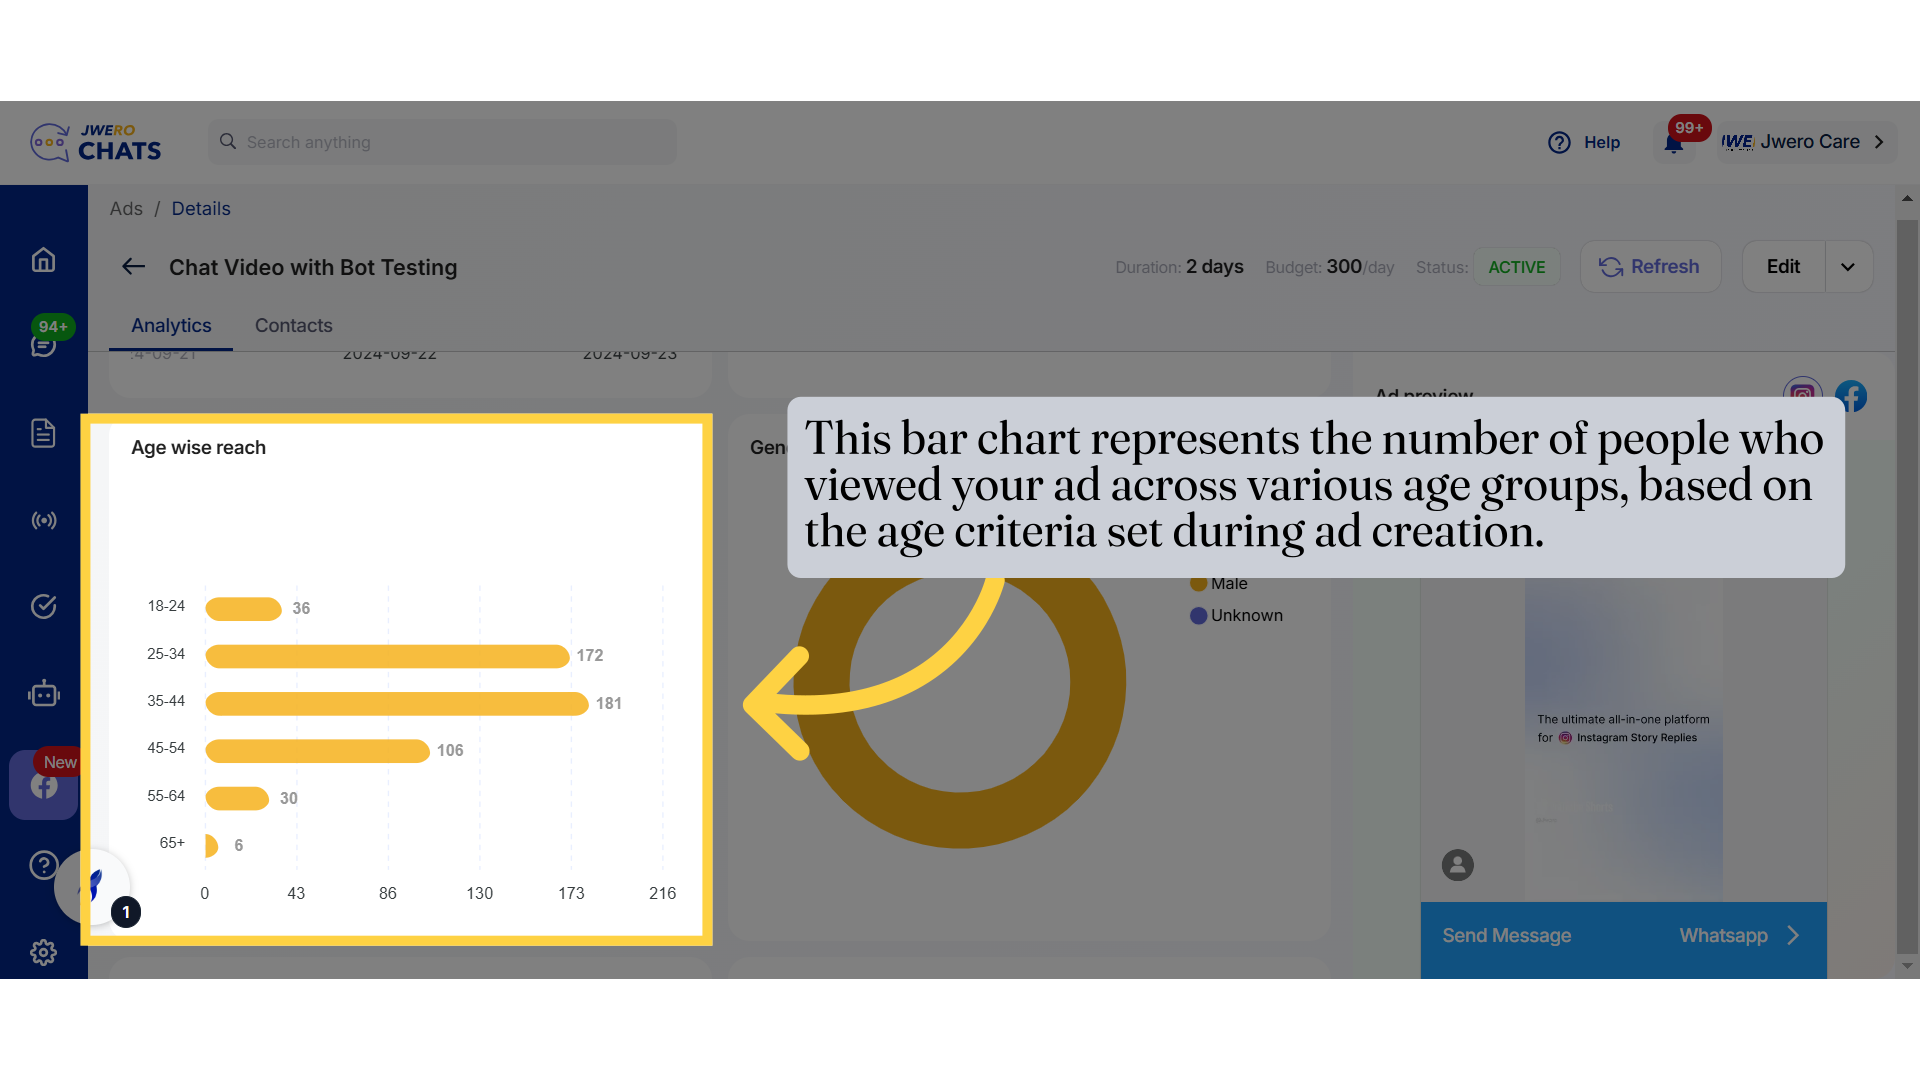
12. Age wise reach
This data helps identify which age groups are most interested in your ad so you can refine targeting for future campaigns.
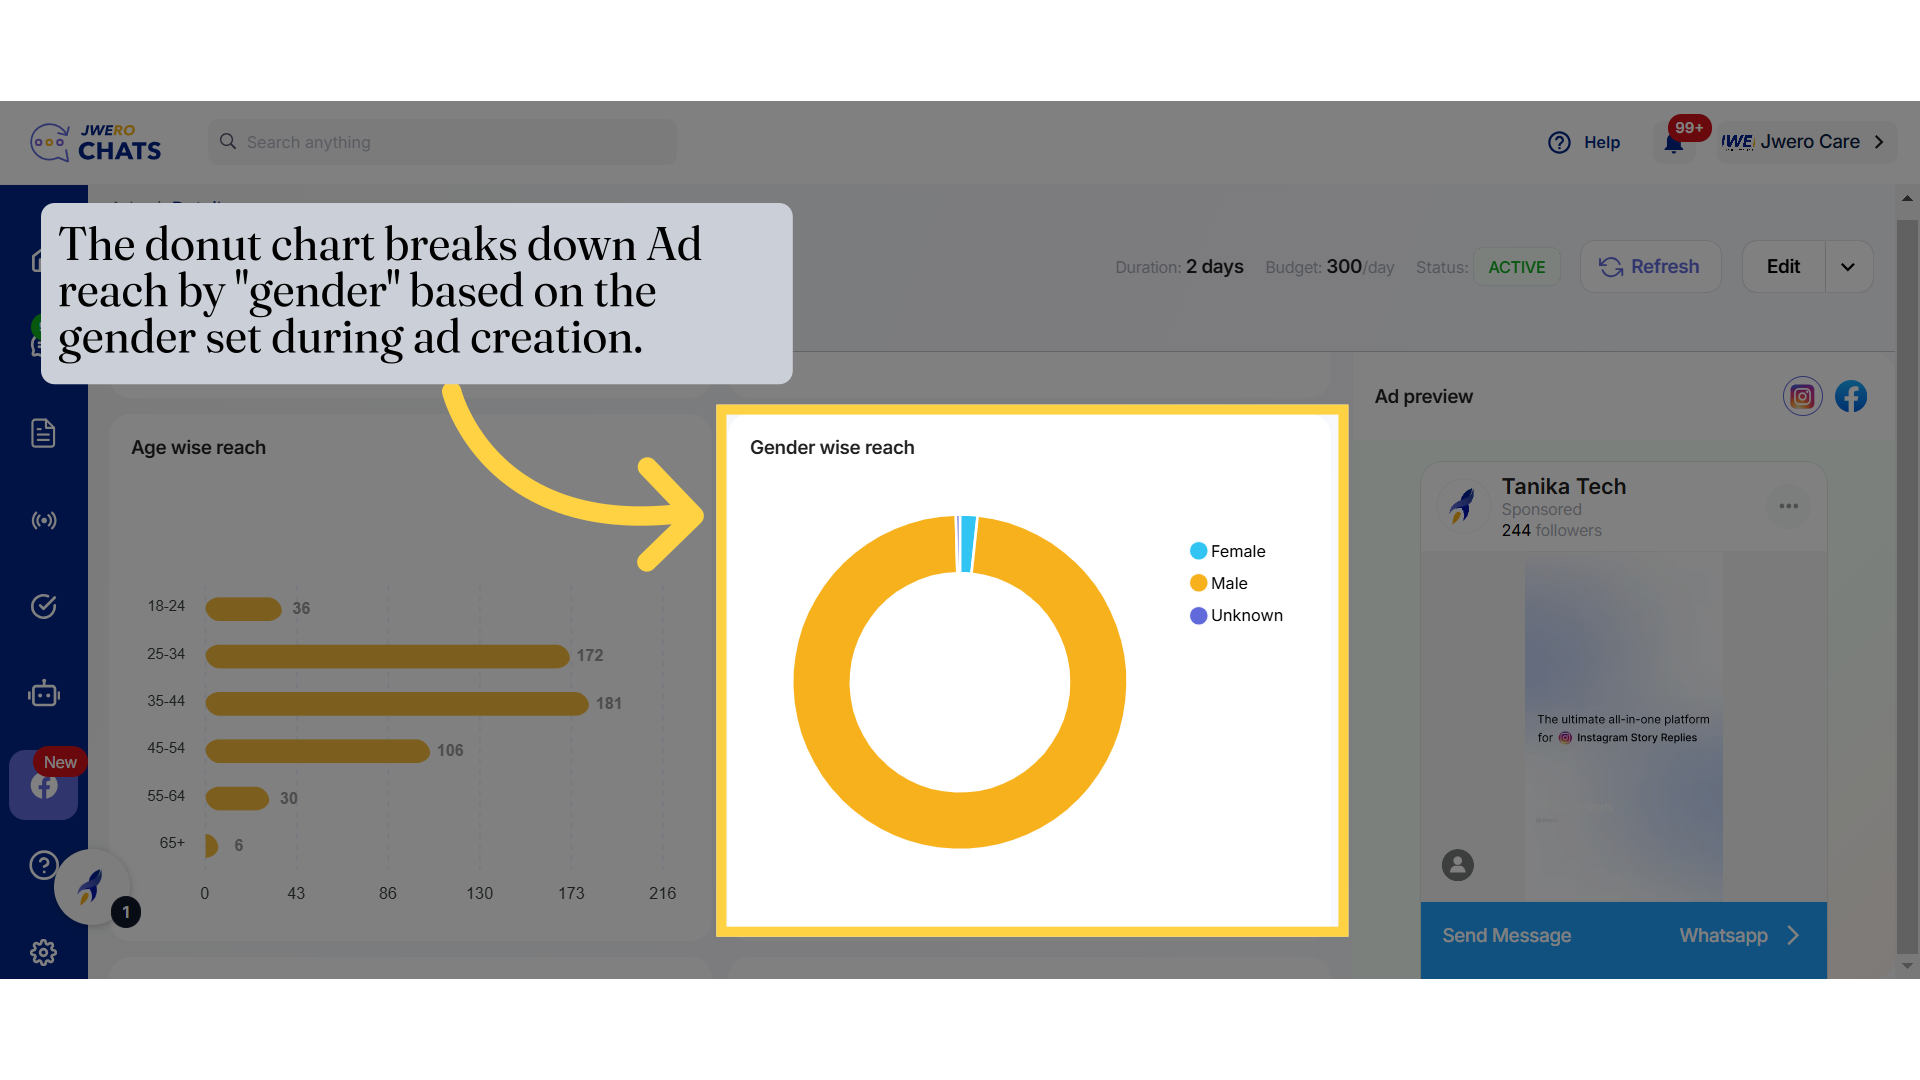
13. Gender wise reach
Male (Yellow): The majority of the audience is male.
Female (Blue): Very small segment of the audience.
Unknown (Purple): A minor percentage of the audience falls under an unknown category (possibly due to limited profile data).
This analysis helps in adjusting ad targeting and messaging based on which gender is engaging more with your ad.
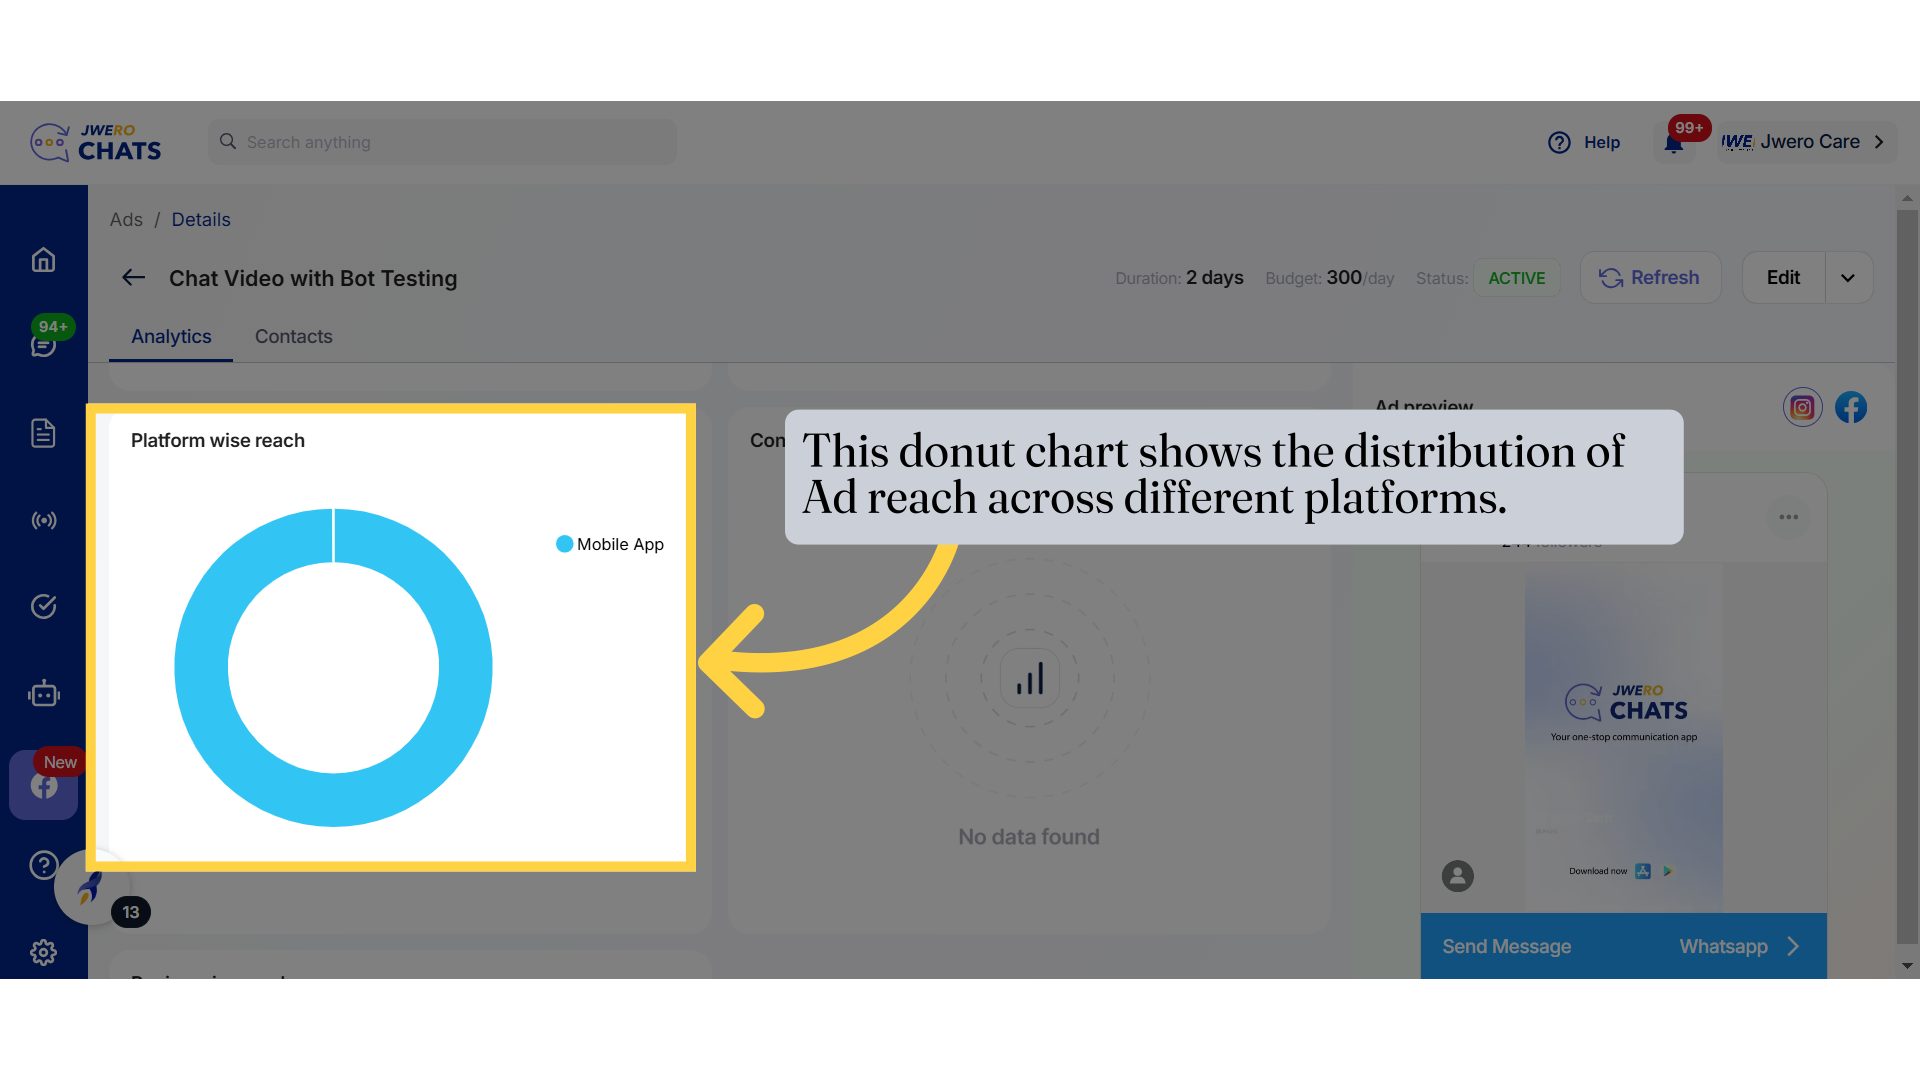
14. Platform wise reach
The entire reach is from Mobile App (represented in blue), meaning all users who viewed or interacted with the ad did so via mobile devices rather than desktop or other platforms.
This insight can help in optimizing ads for mobile users by ensuring mobile-friendly creatives and messages.
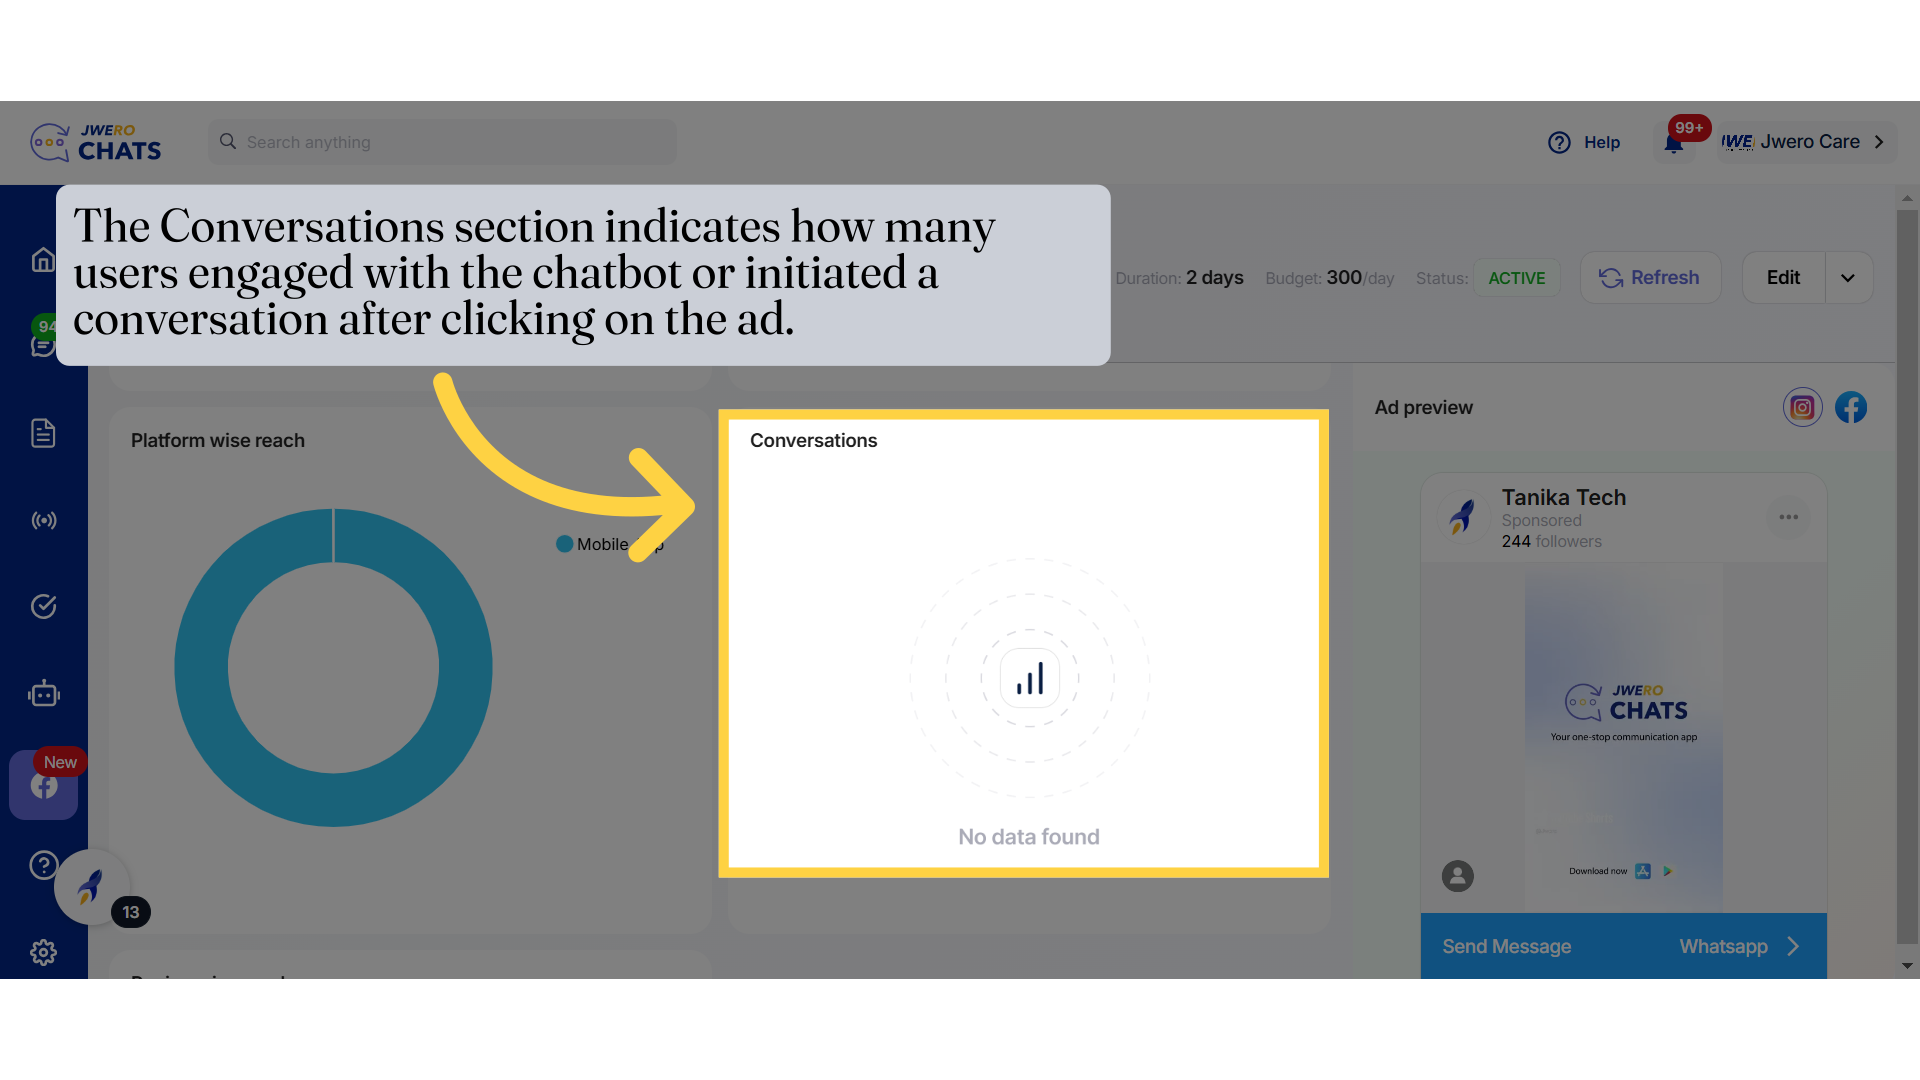
15. The Conversations section indicates how many users engaged with the chatbot or initiated a conversation after clicking on the ad.
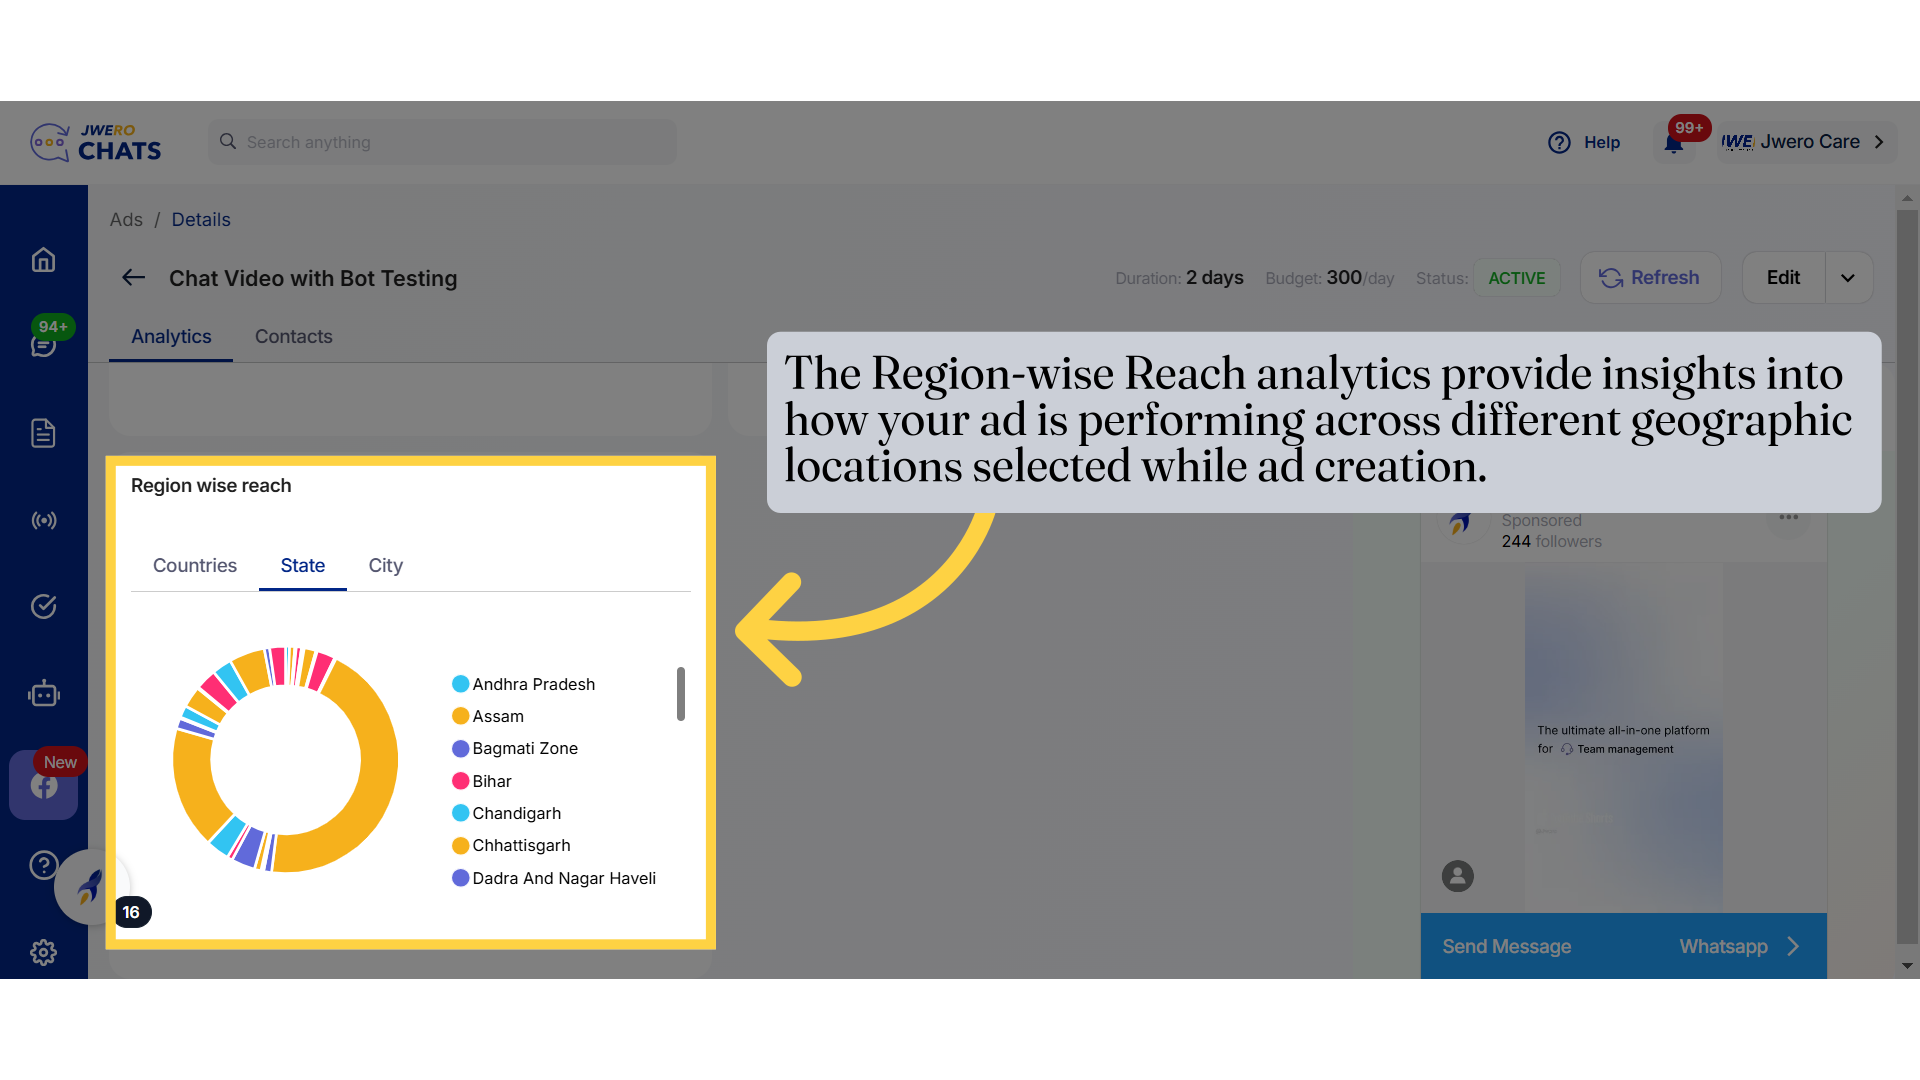
16. Region-wise Reach
Key Insights from Region-wise Reach:
Audience Distribution: See which regions have the most impressions and engagements.
Performance Comparison: Identify high-performing locations to refine future ad targeting.
Optimization Strategy: Adjust your ad placements based on the best-performing regions.
This metric is crucial for businesses aiming to target specific areas effectively and maximize ad reach.
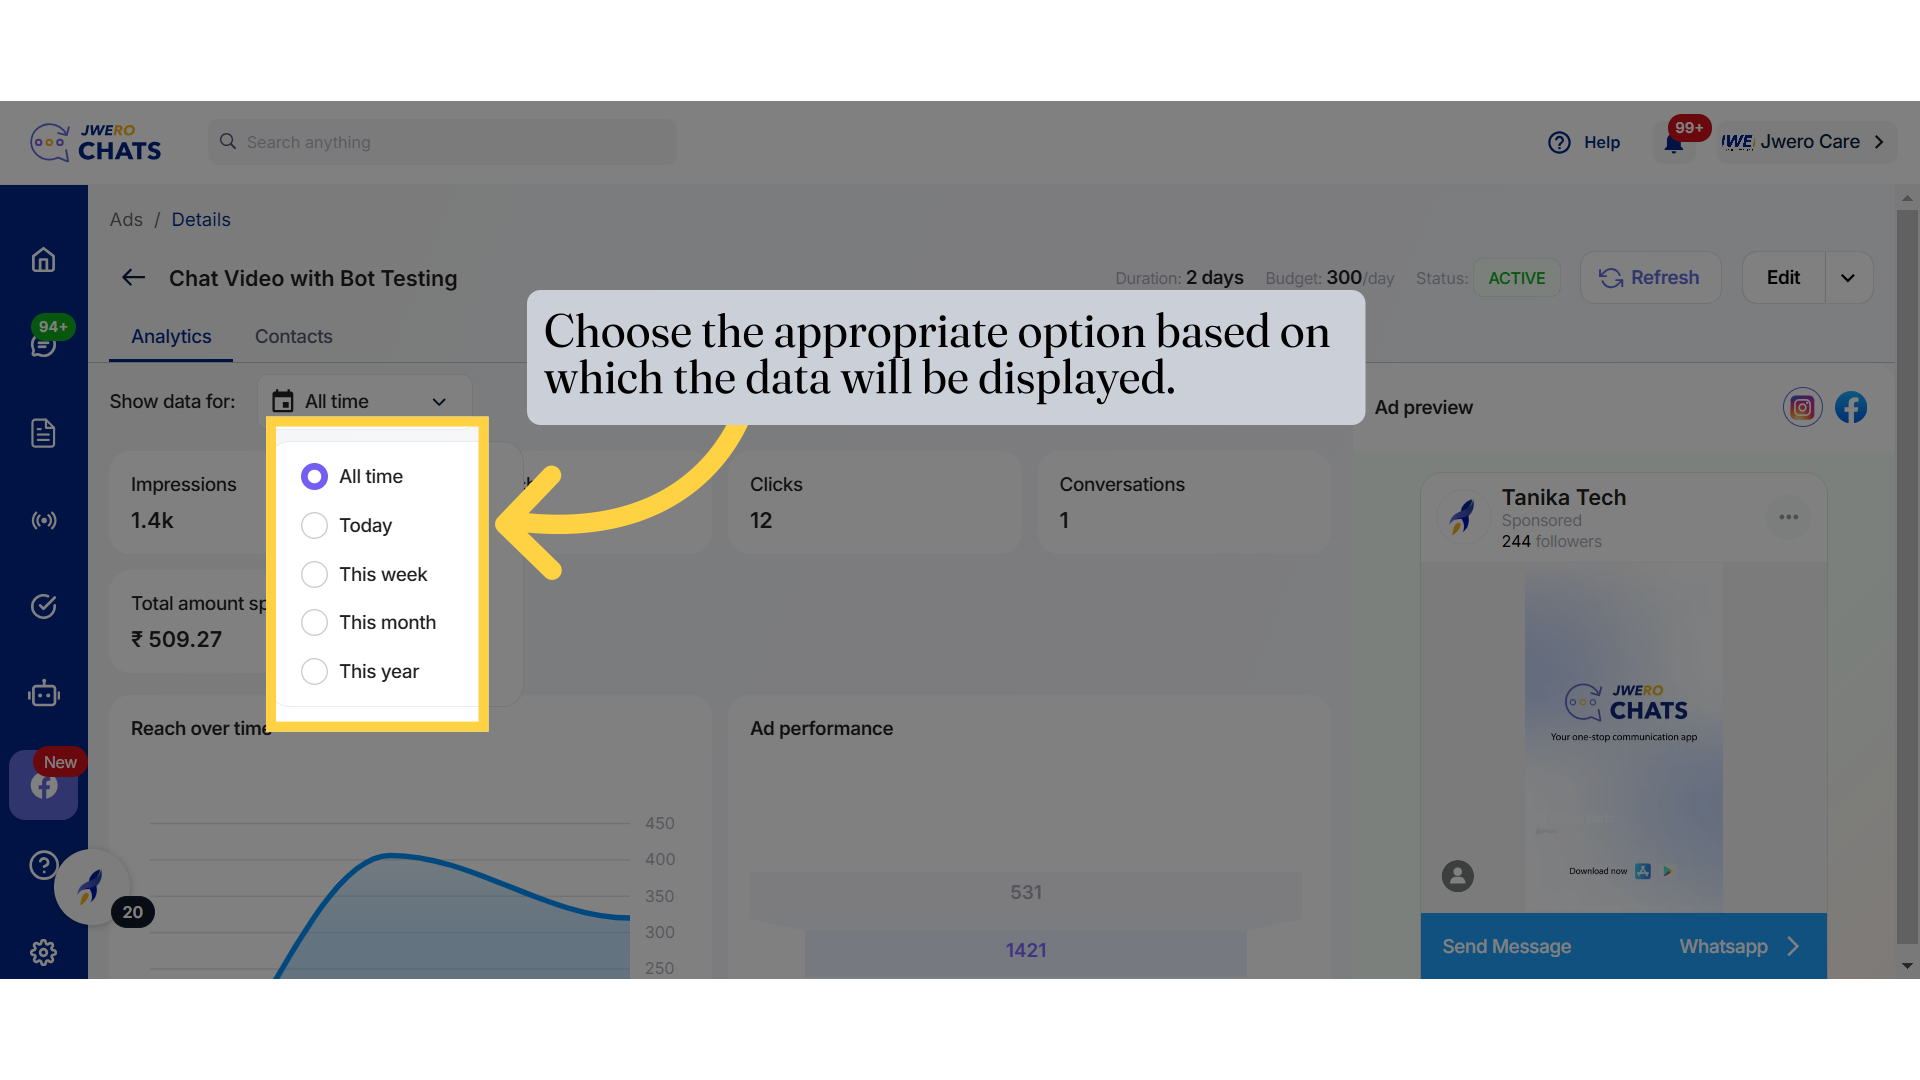
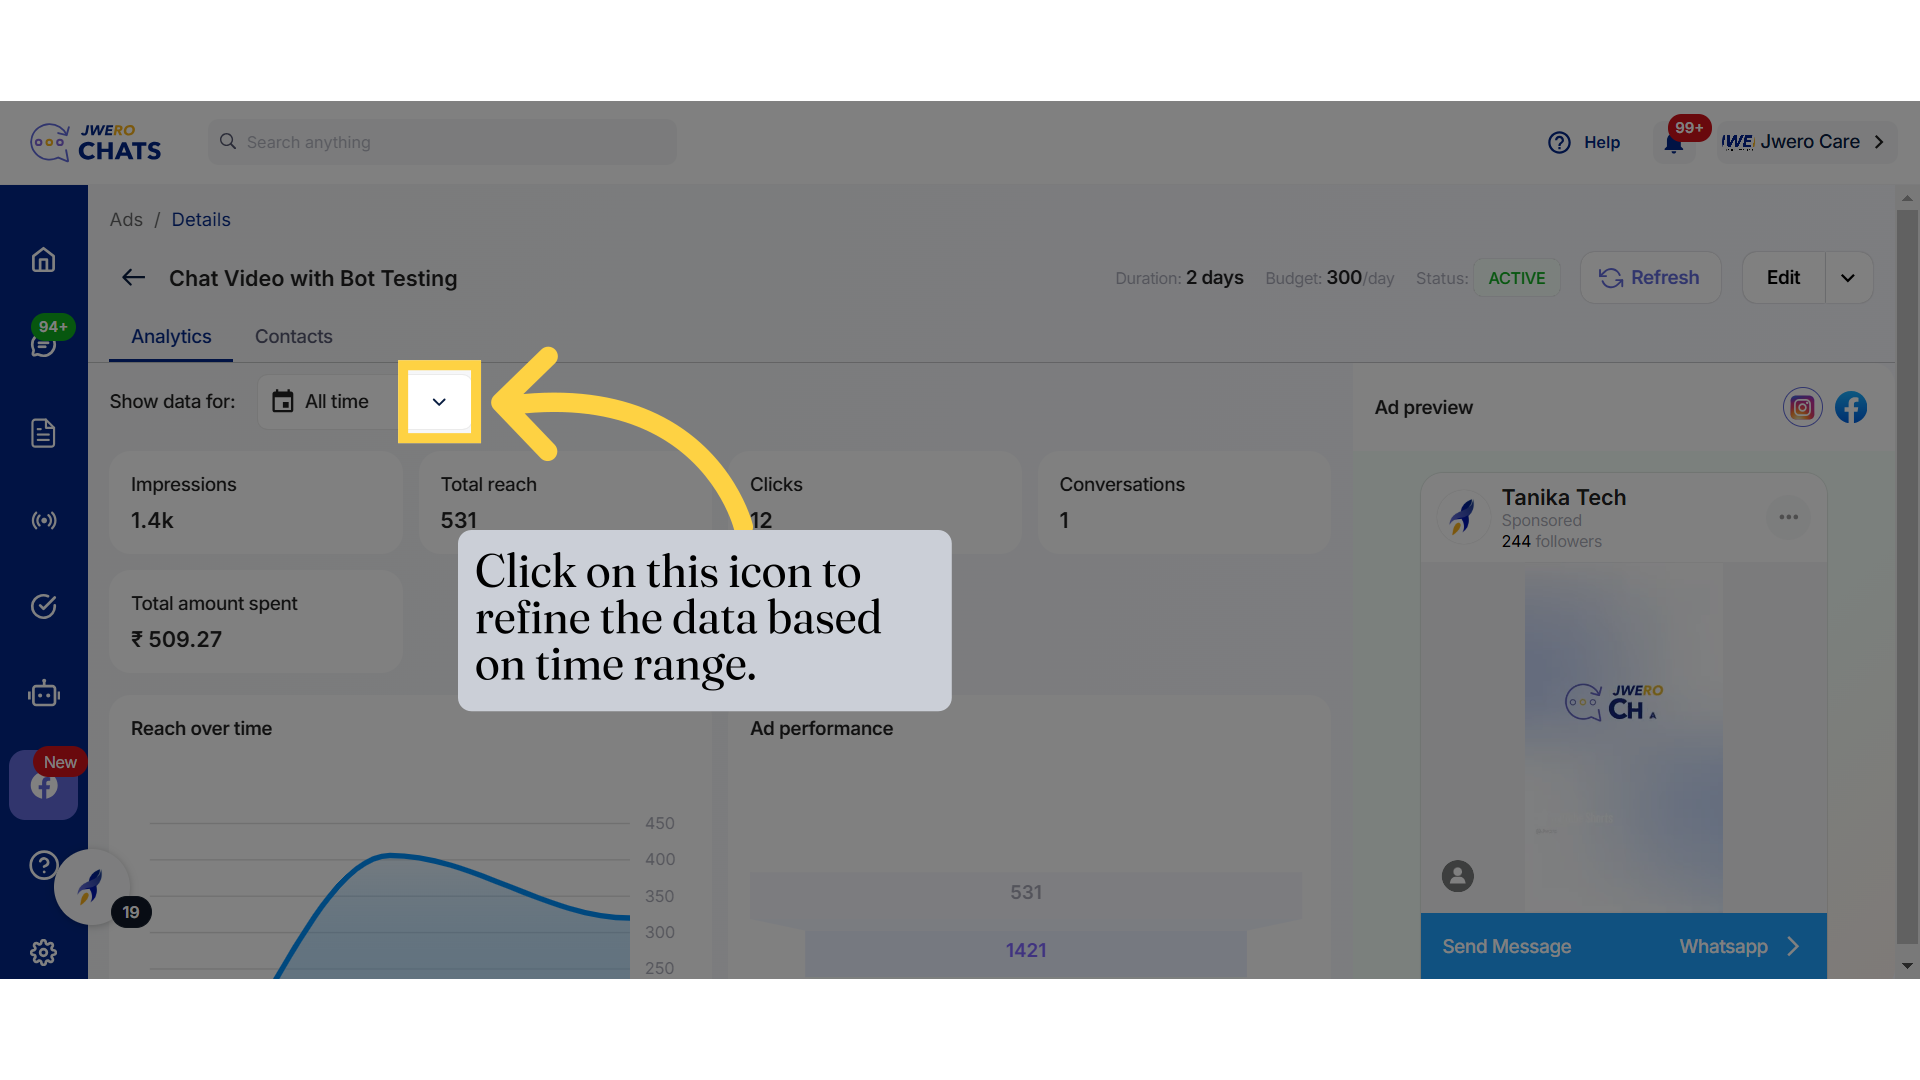
17. Click on this icon to refine the data based on time range.
18. Choose the appropriate option based on which the data will be displayed.